
 Copernicus · Territorial Intelligence
Fire over the native dry forest of western Formosa
Satellite reconstruction of the wildfire event of 24 to 28 September 2026 in western Formosa: the magnitude of the fire, the land cover over which it occurred, and its territorial context. All measured with open data, reproducible pixel by pixel — and corroborated by three independent satellite systems.
1 · The event
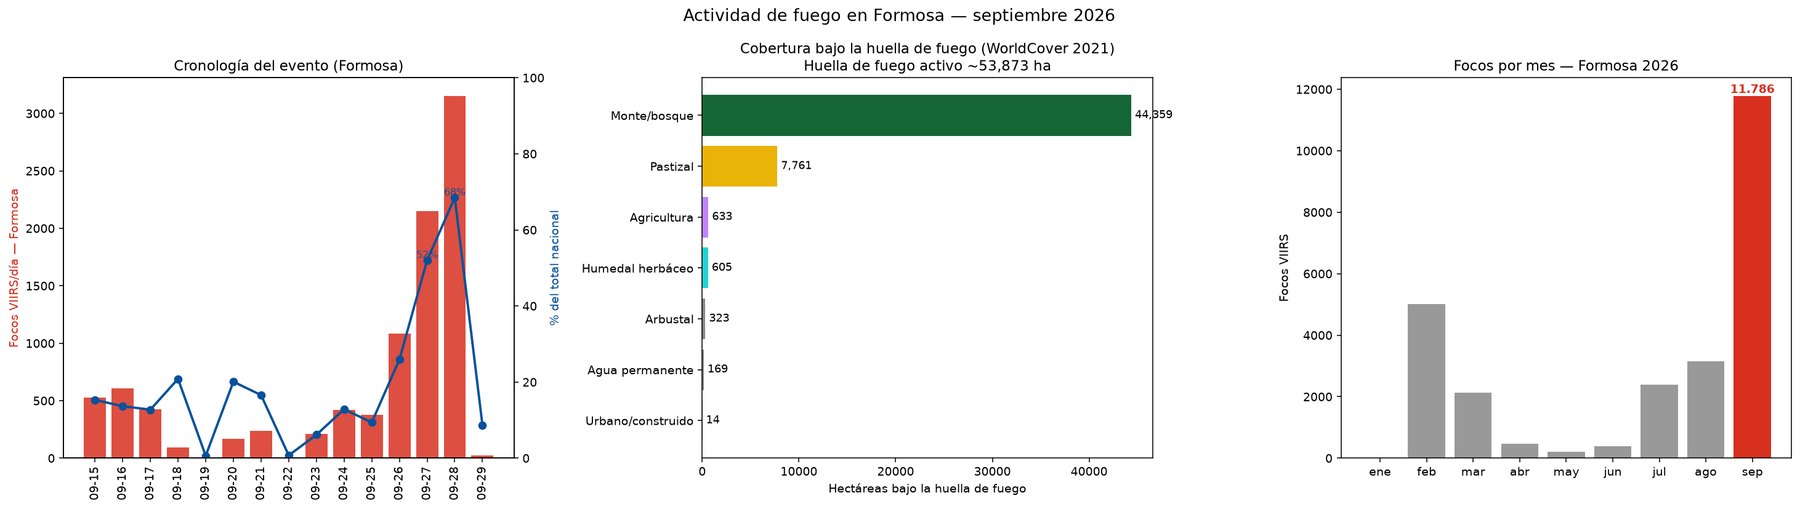
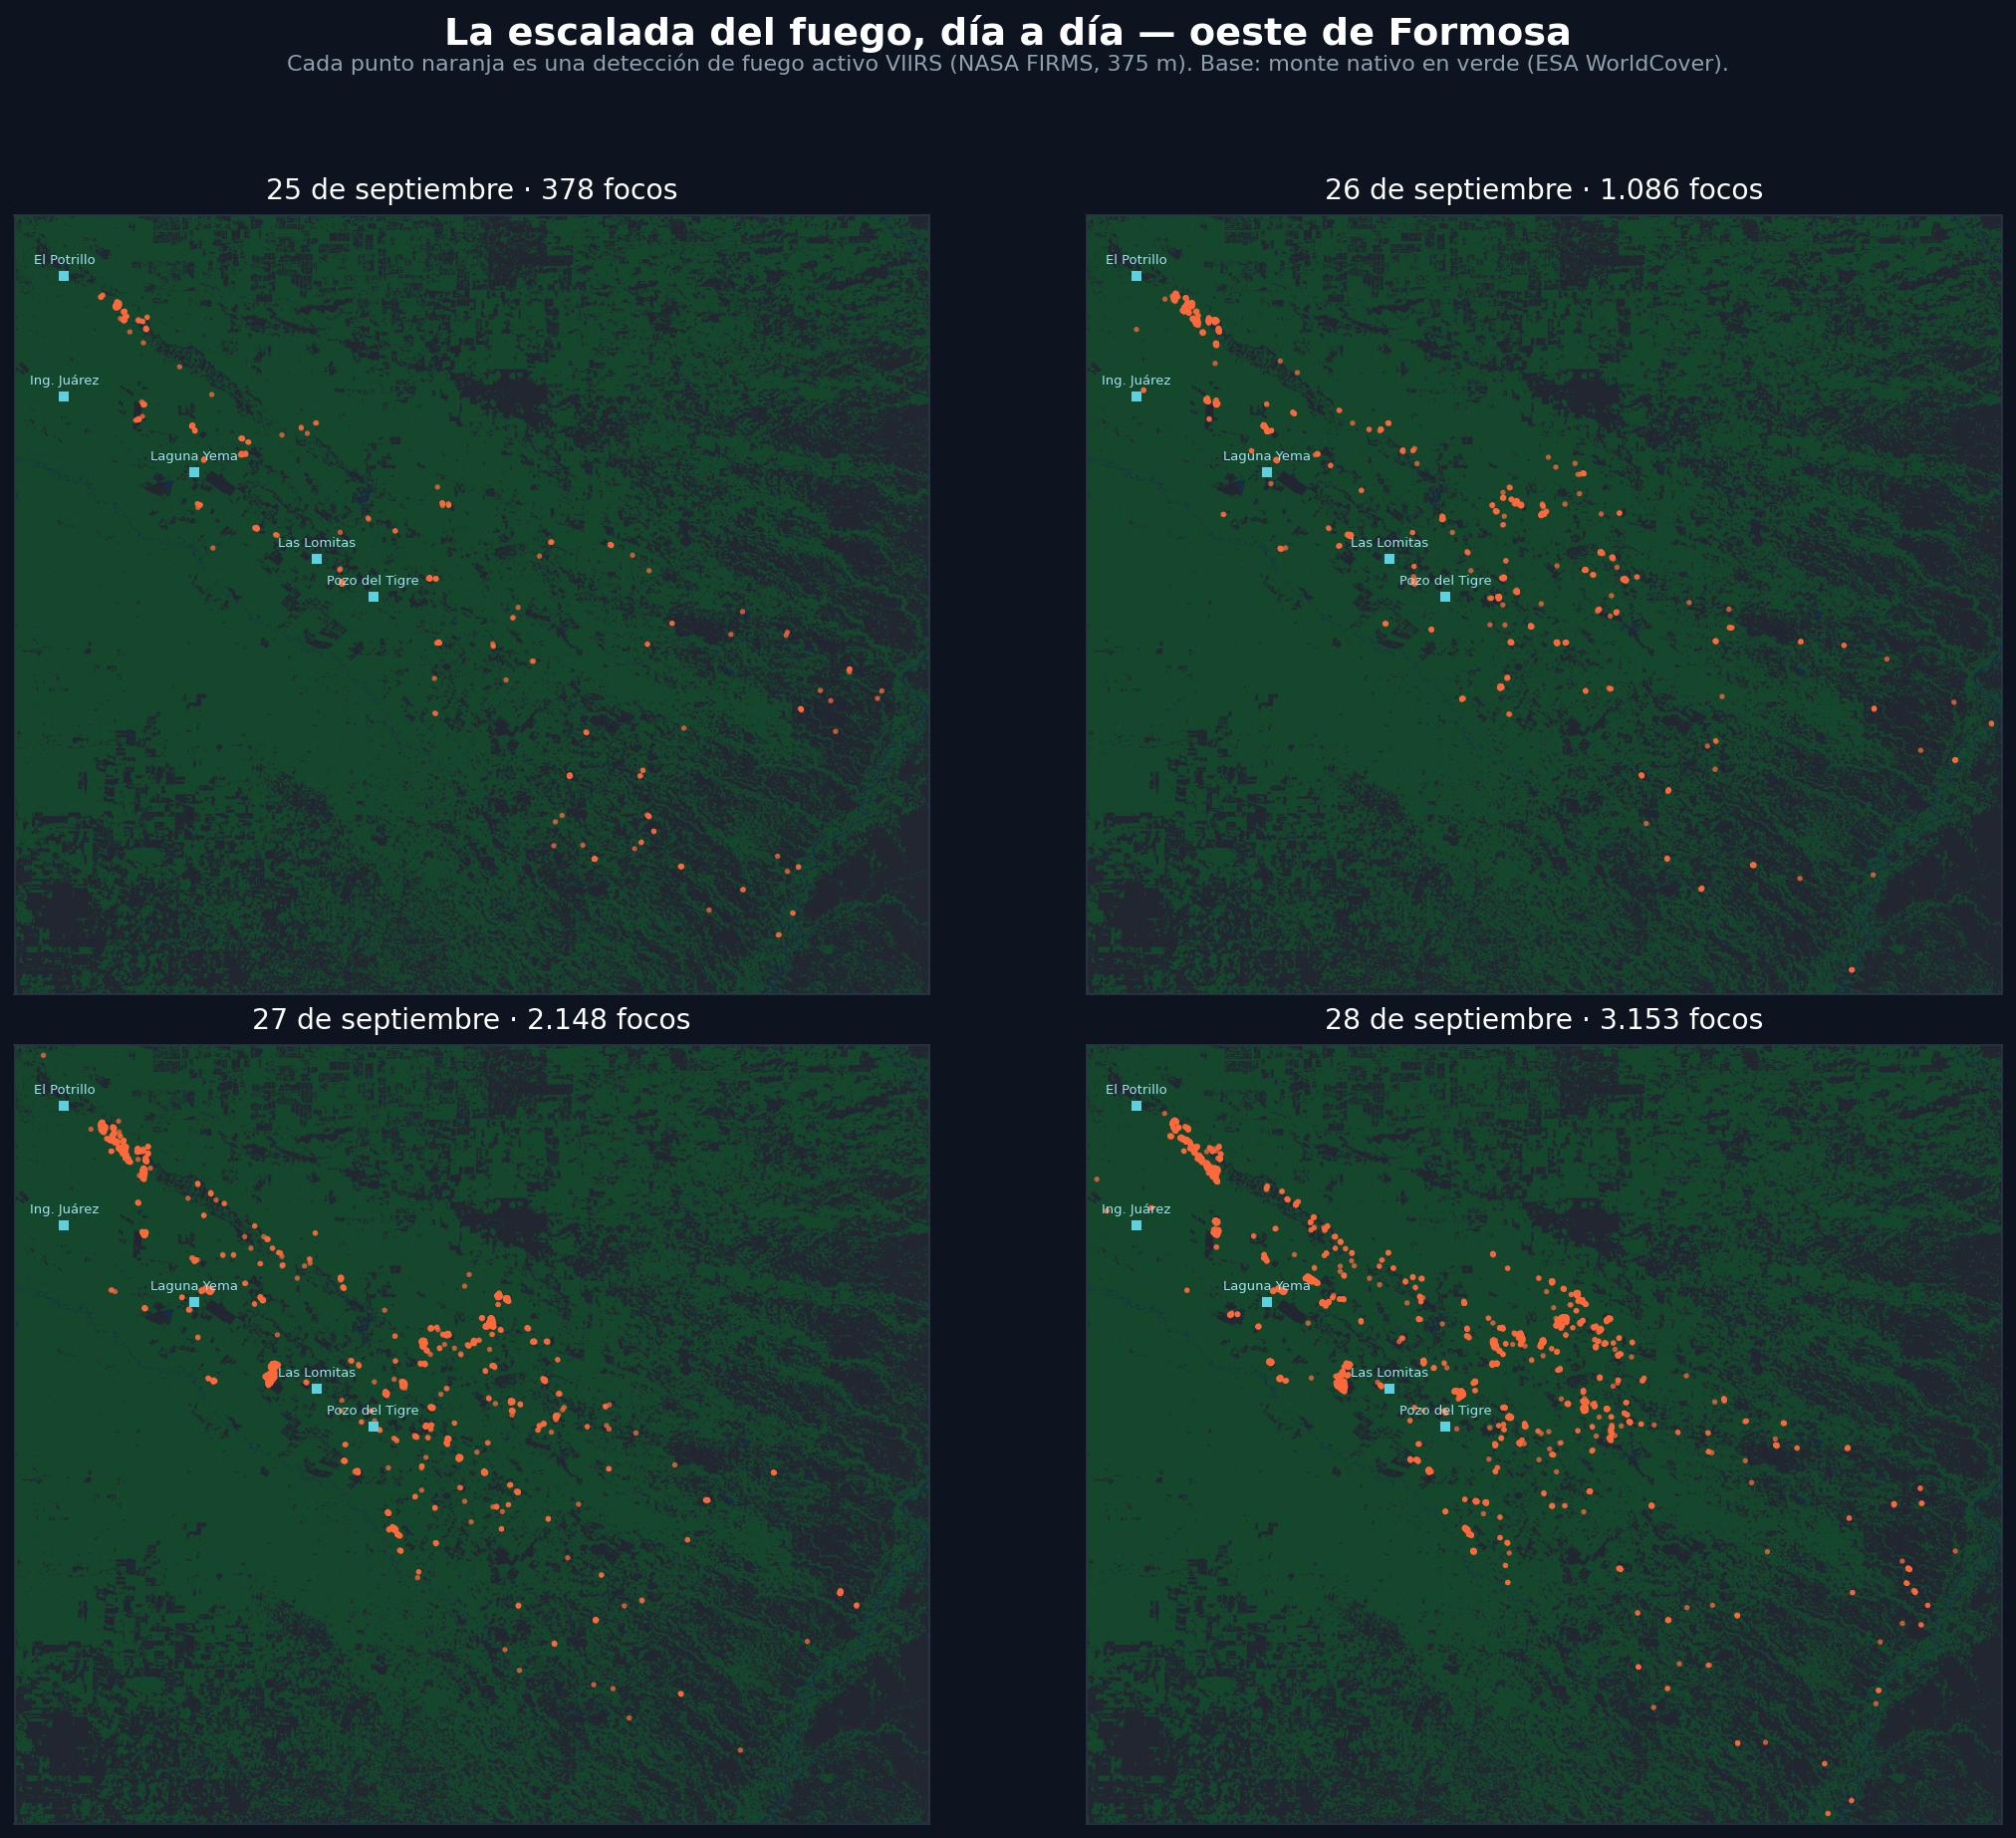
Between 24 and 28 September, western Formosa recorded the highest fire activity of the year. Detections rose from normal dry-season levels to a pronounced peak within three days: 1,086 hotspots on 26/09 → 2,148 on 27/09 → 3,153 on 28/09, with a maximum radiated energy (FRP) of 68,209 MW. On 29/09 a cold front with rainfall (18 mm over the fire zone) halted activity: hotspots fell to 25 in a single day.
At the event's peak, more than two thirds of Argentina's active hotspots were recorded in the province of Formosa.
2 · The geographical scale
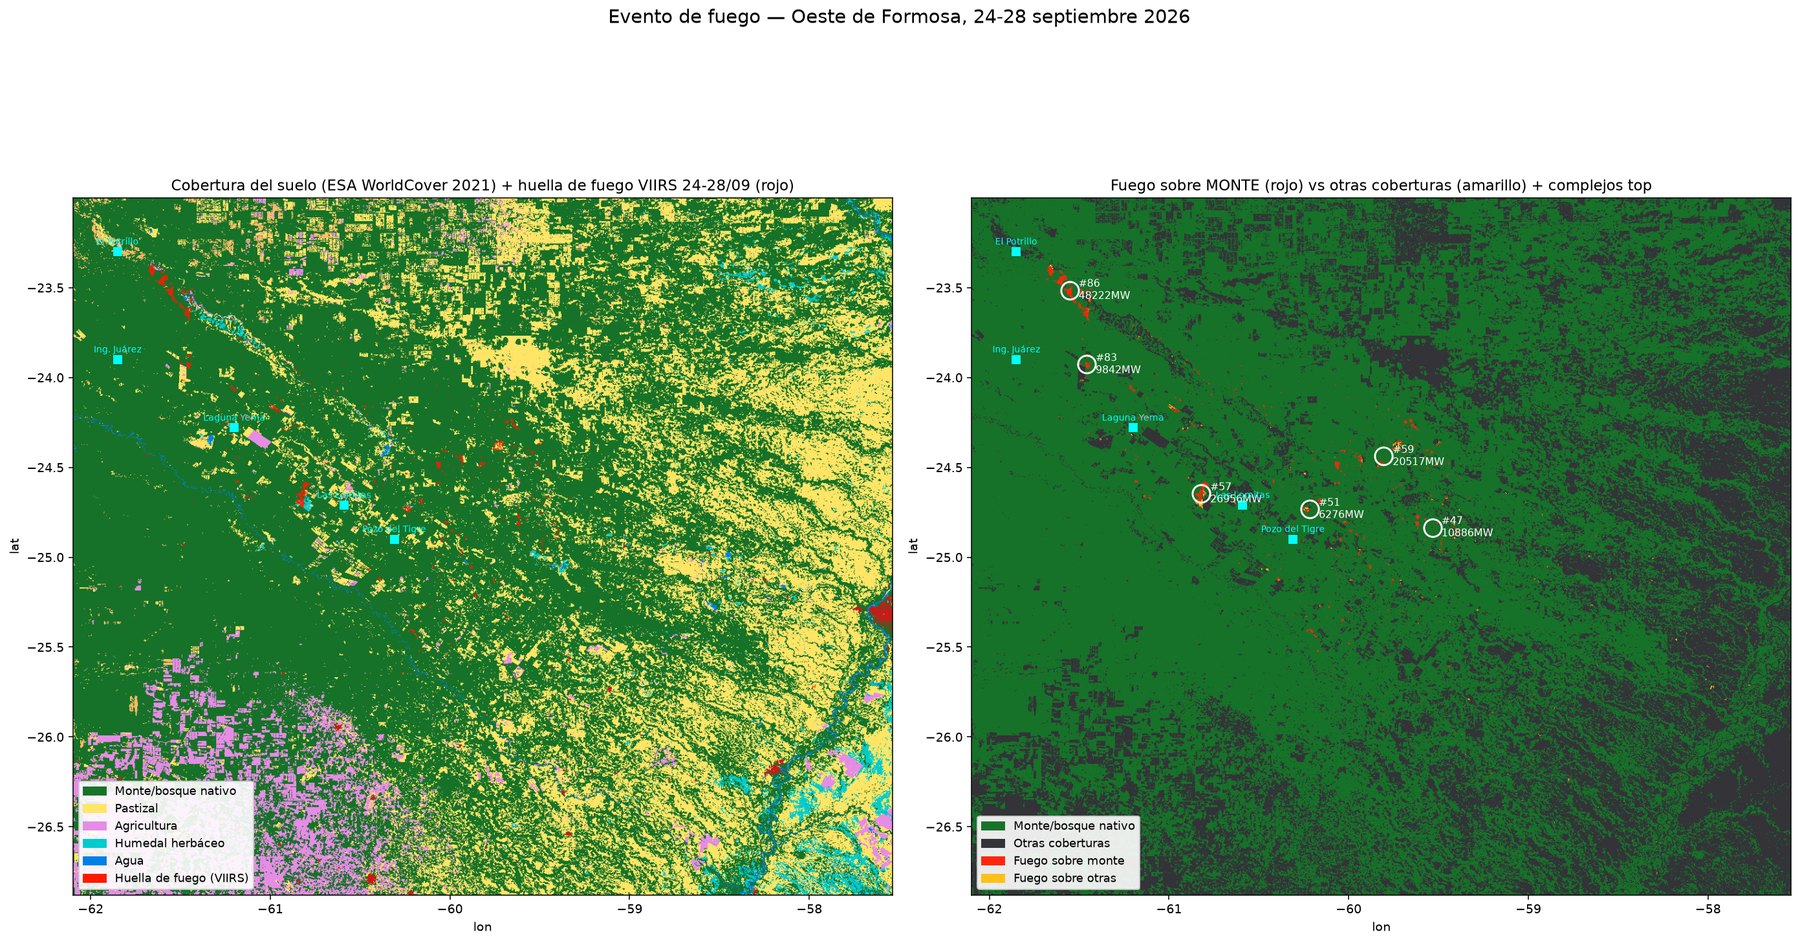
The fire was not a single blaze but a complex of 86 simultaneous active hotspots distributed across the dry Chaco of central-western Formosa. The 5 most intense complexes concentrated 72% of all the radiated energy. The epicentre of the event —confirmed by the official coverage— was Pozo de Maza (Ramón Lista department) and the settlements of La Madrugada, La Rinconada, Isla García, El Chañaral, and Los Cieneguitos.
Cross-validation — three satellite systems agree
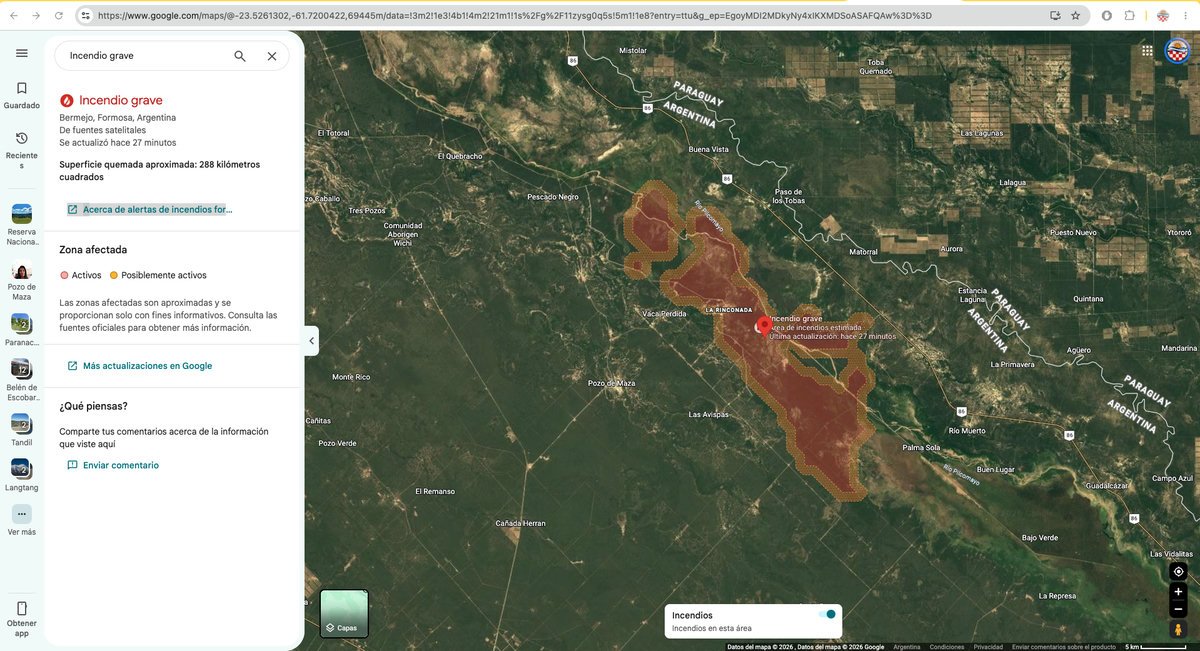
The most intense complex in our analysis (Bermejo nucleus, ~23.5°S 61.5°W, 48,222 MW of radiated energy) is independently flagged by Google's wildfire alert system, fed by its own satellite sources. This is not the reading of a single instrument: NASA VIIRS, ESA Sentinel-2, and Google all point to the same nucleus and agree on its location and severity.
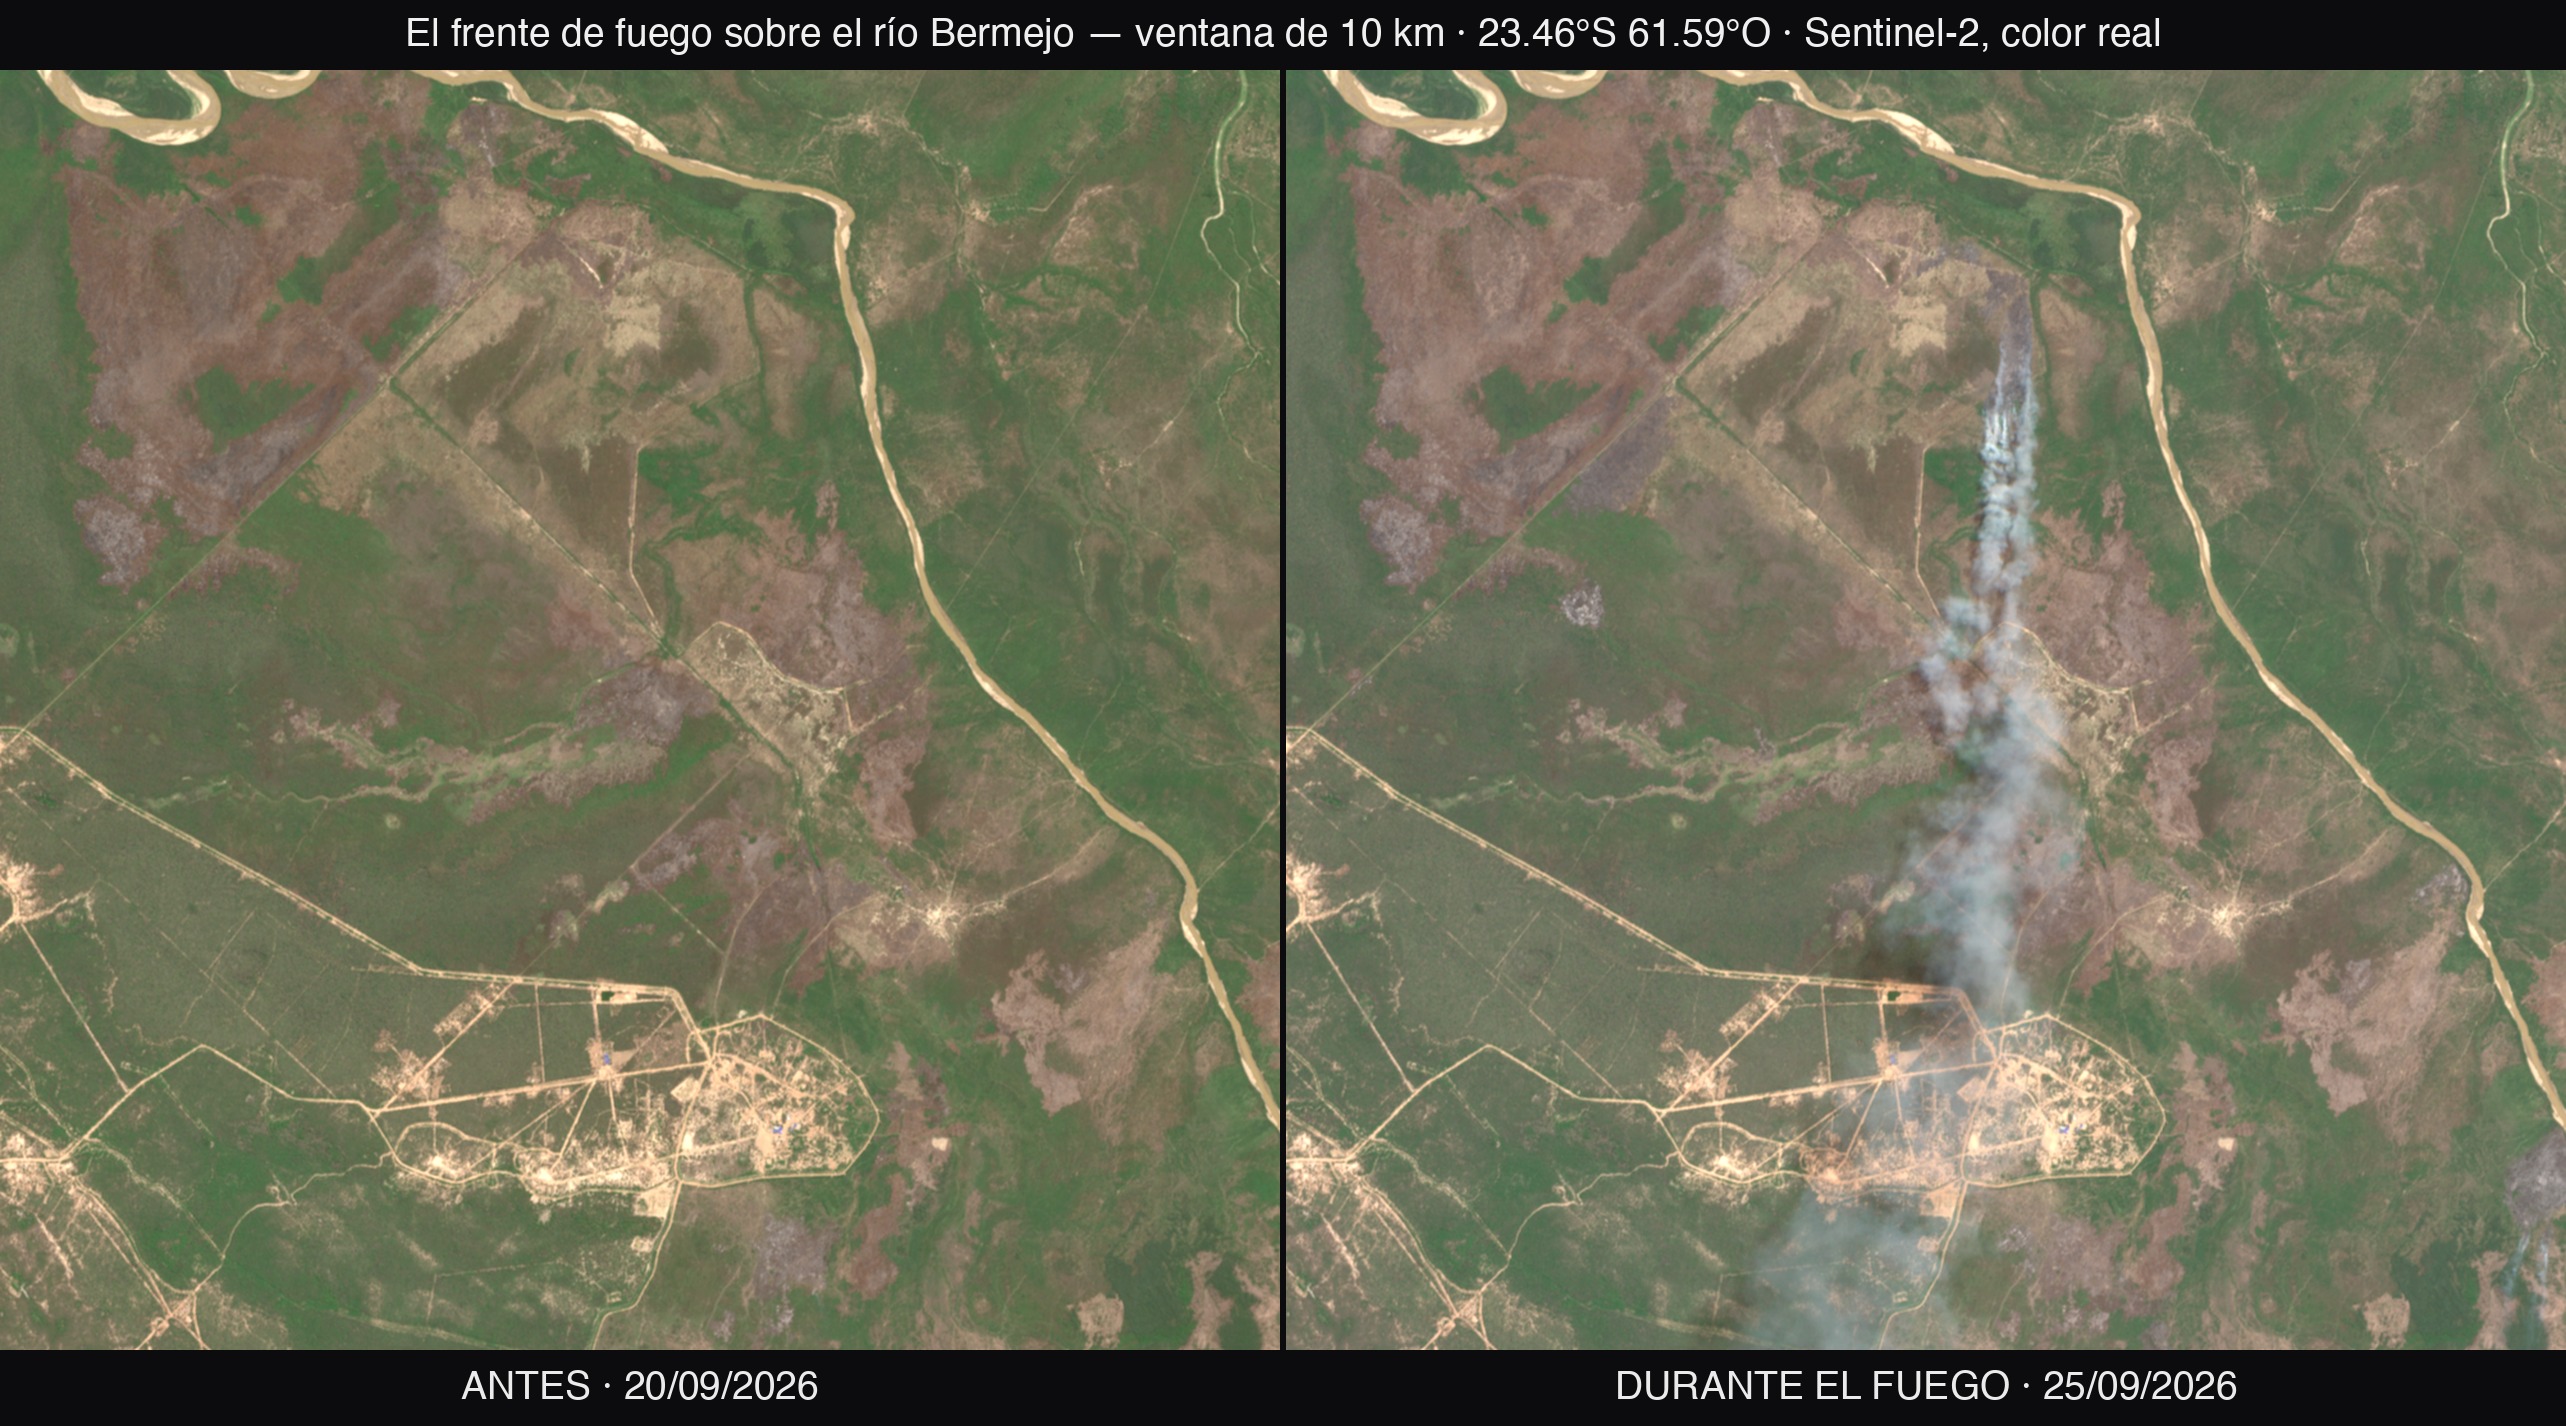
The epicentre, photographed during the fire
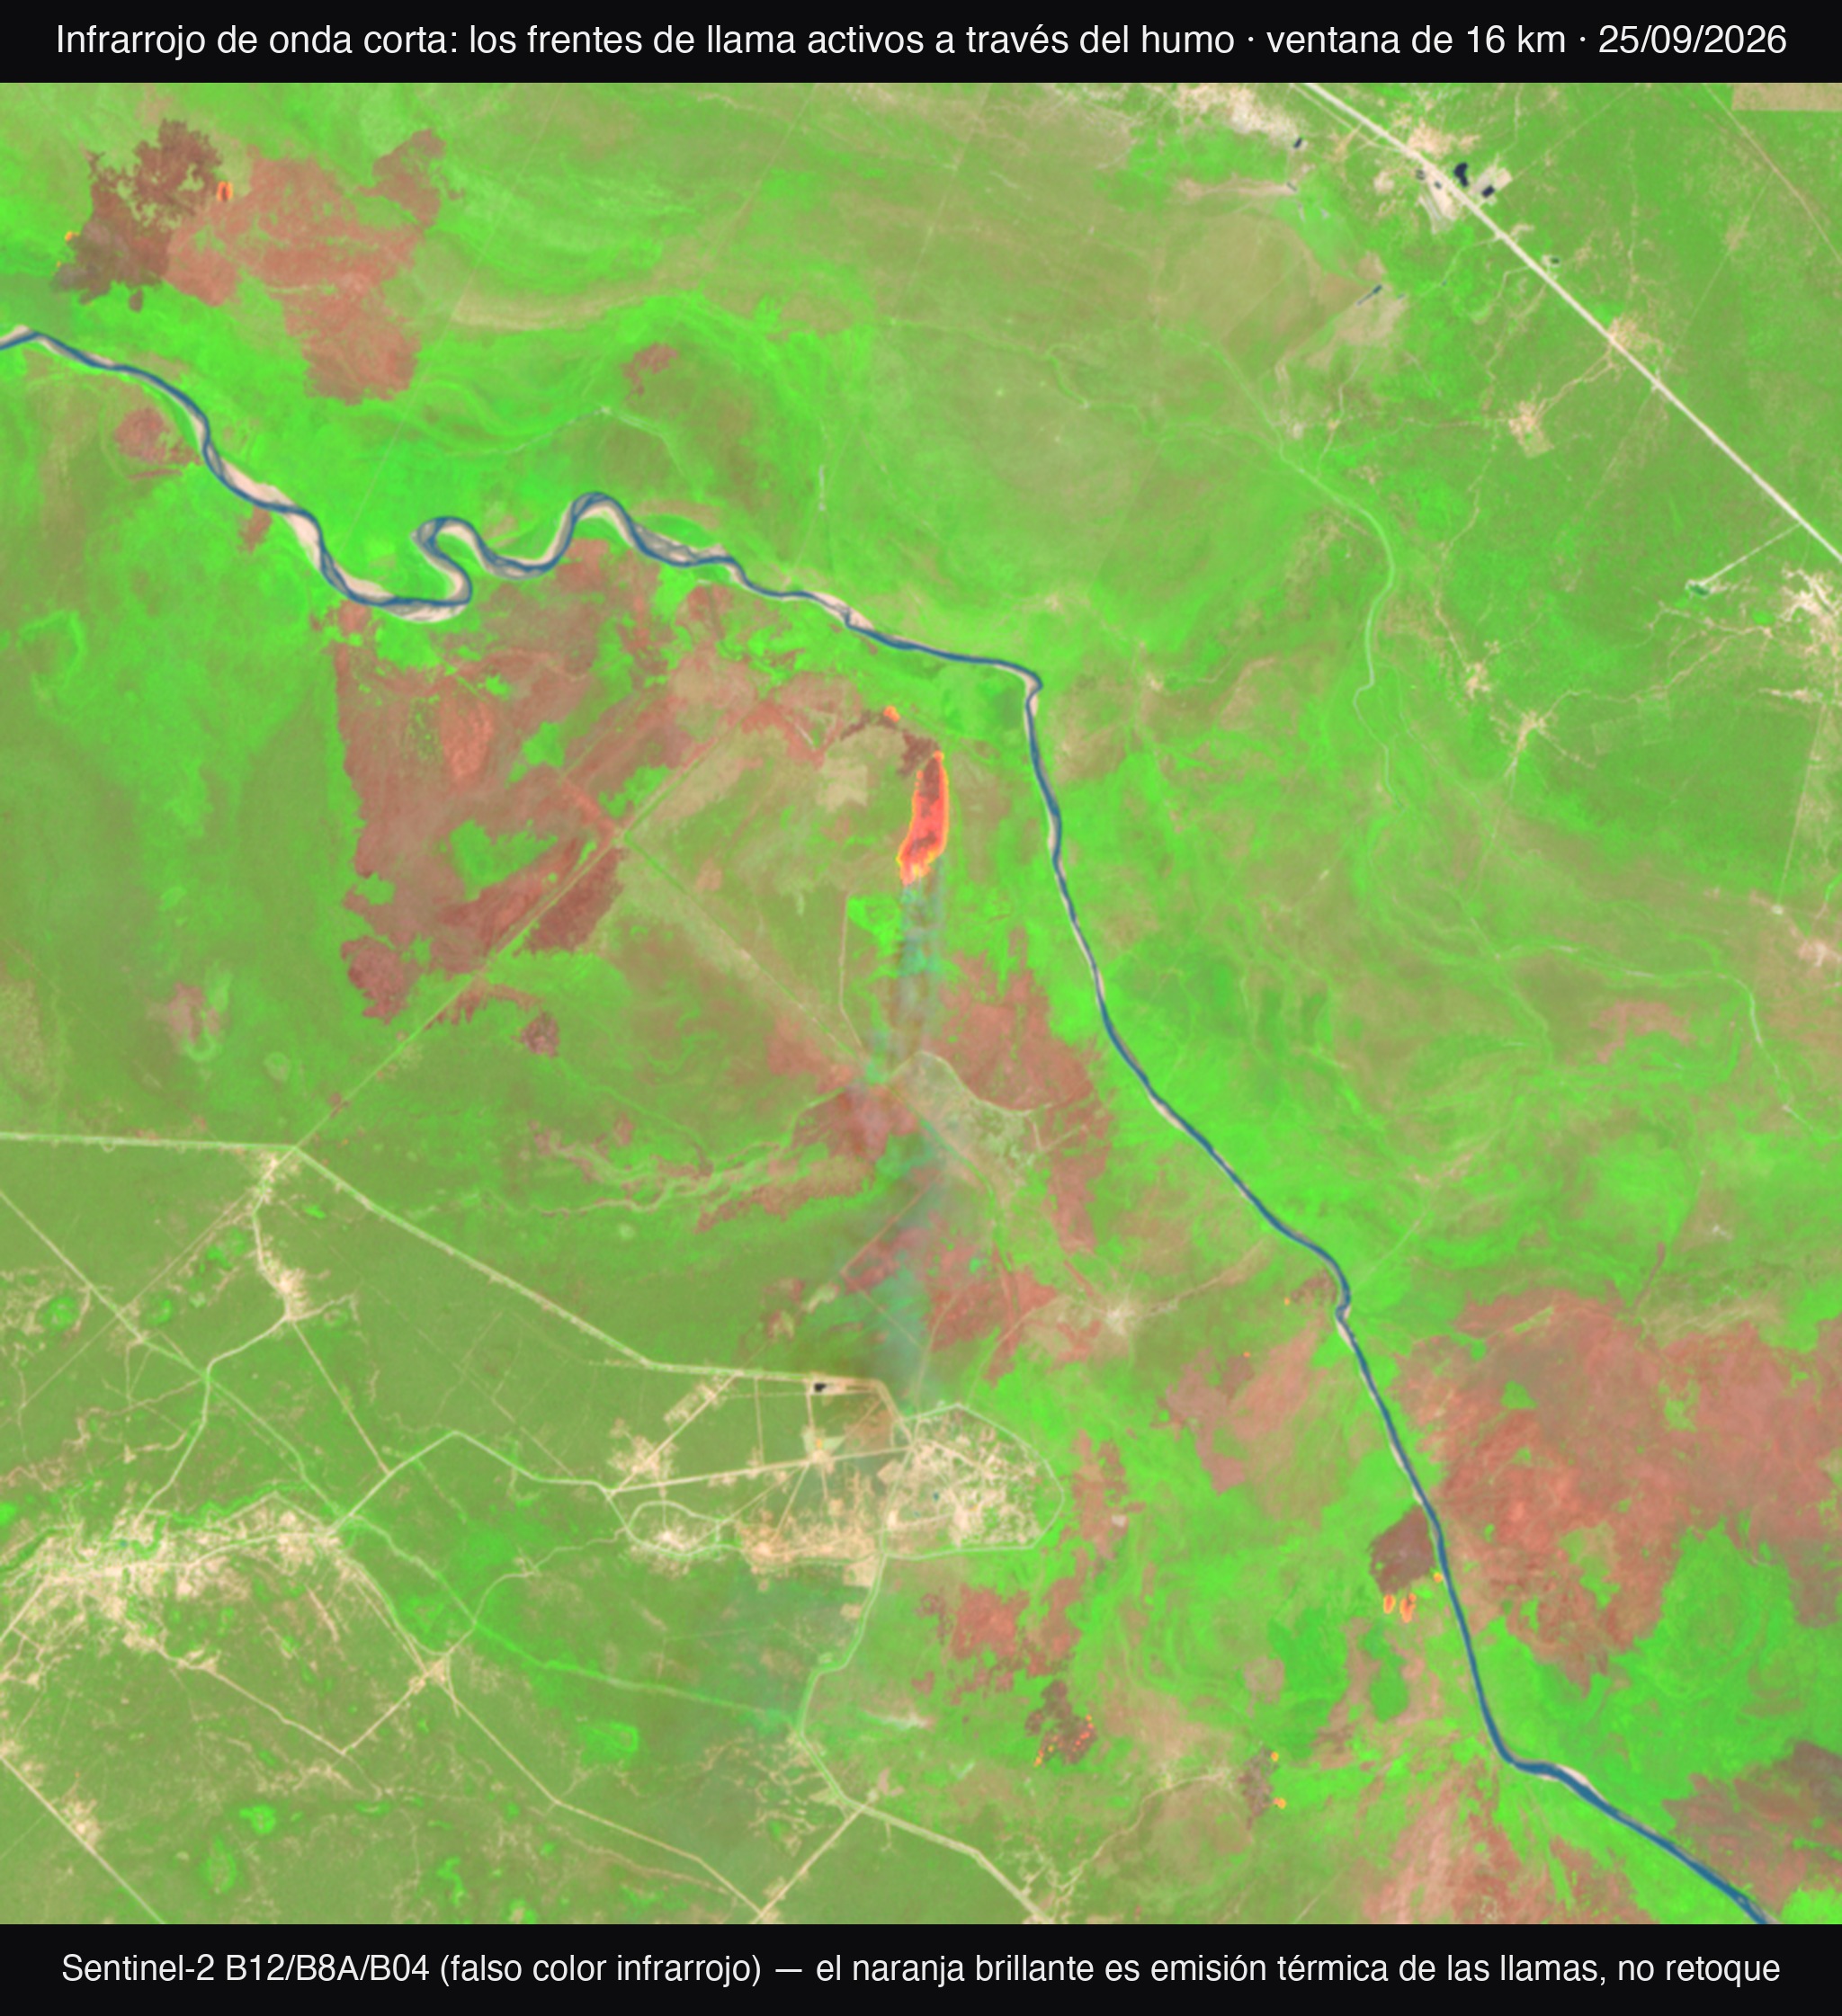
Sentinel-2 passed over the Bermejo nucleus on 25 September, with the fire in full escalation, and left a direct record: the same forest that five days earlier was intact, burning.
3 · Land cover under the fire: the native dry forest (monte)
Crossing the active-fire footprint with the reference land cover (ESA WorldCover, 10 m), the result is the central finding of this study. The hectares in the table represent the area of each cover type under the fire footprint, not confirmed burned area (see methodology):
| Cover under the fire footprint | Ha under the footprint | % of footprint | % in the region |
|---|---|---|---|
| 🌳 Native dry forest (monte) | 44,359 | 82.4% | 67.4% |
| 🌾 Grassland | 7,761 | 14.4% | 24.0% |
| 🌱 Cropland | 633 | 1.2% | 5.9% |
| 💧 Herbaceous wetland | 605 | 1.1% | 1.3% |
| 🏜️ Shrubland | 323 | 0.6% | 0.9% |
| 🌊 Permanent water | 169 | 0.3% | 0.4% |
4 · The burn scar, up close
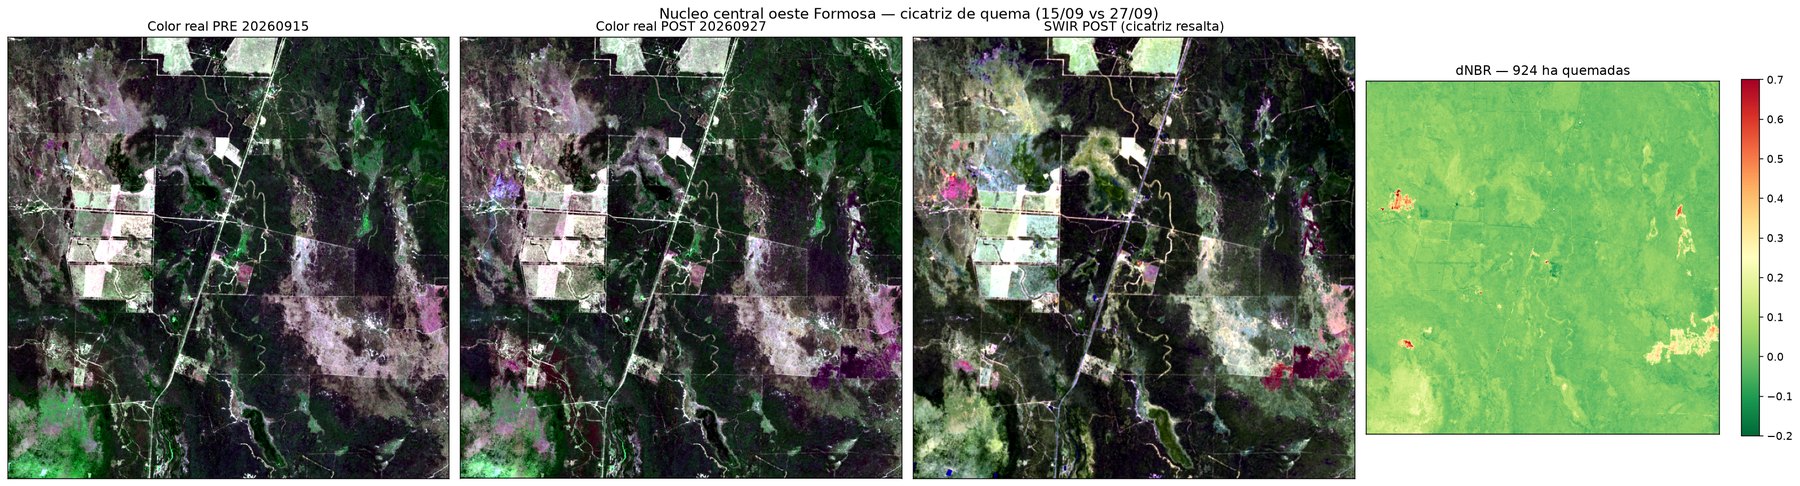
To verify that the satellite signature corresponds to actual burning and not noise, the dNBR (differenced normalised burn ratio, Sentinel-2 at 20 m) was computed over a 14×14 km window of the central nucleus, comparing a clean pre-fire image (15/09) with a post-fire image (27/09, 100% clear sky).
Update 04/10 — the post-peak measurement (scene of 02/10)
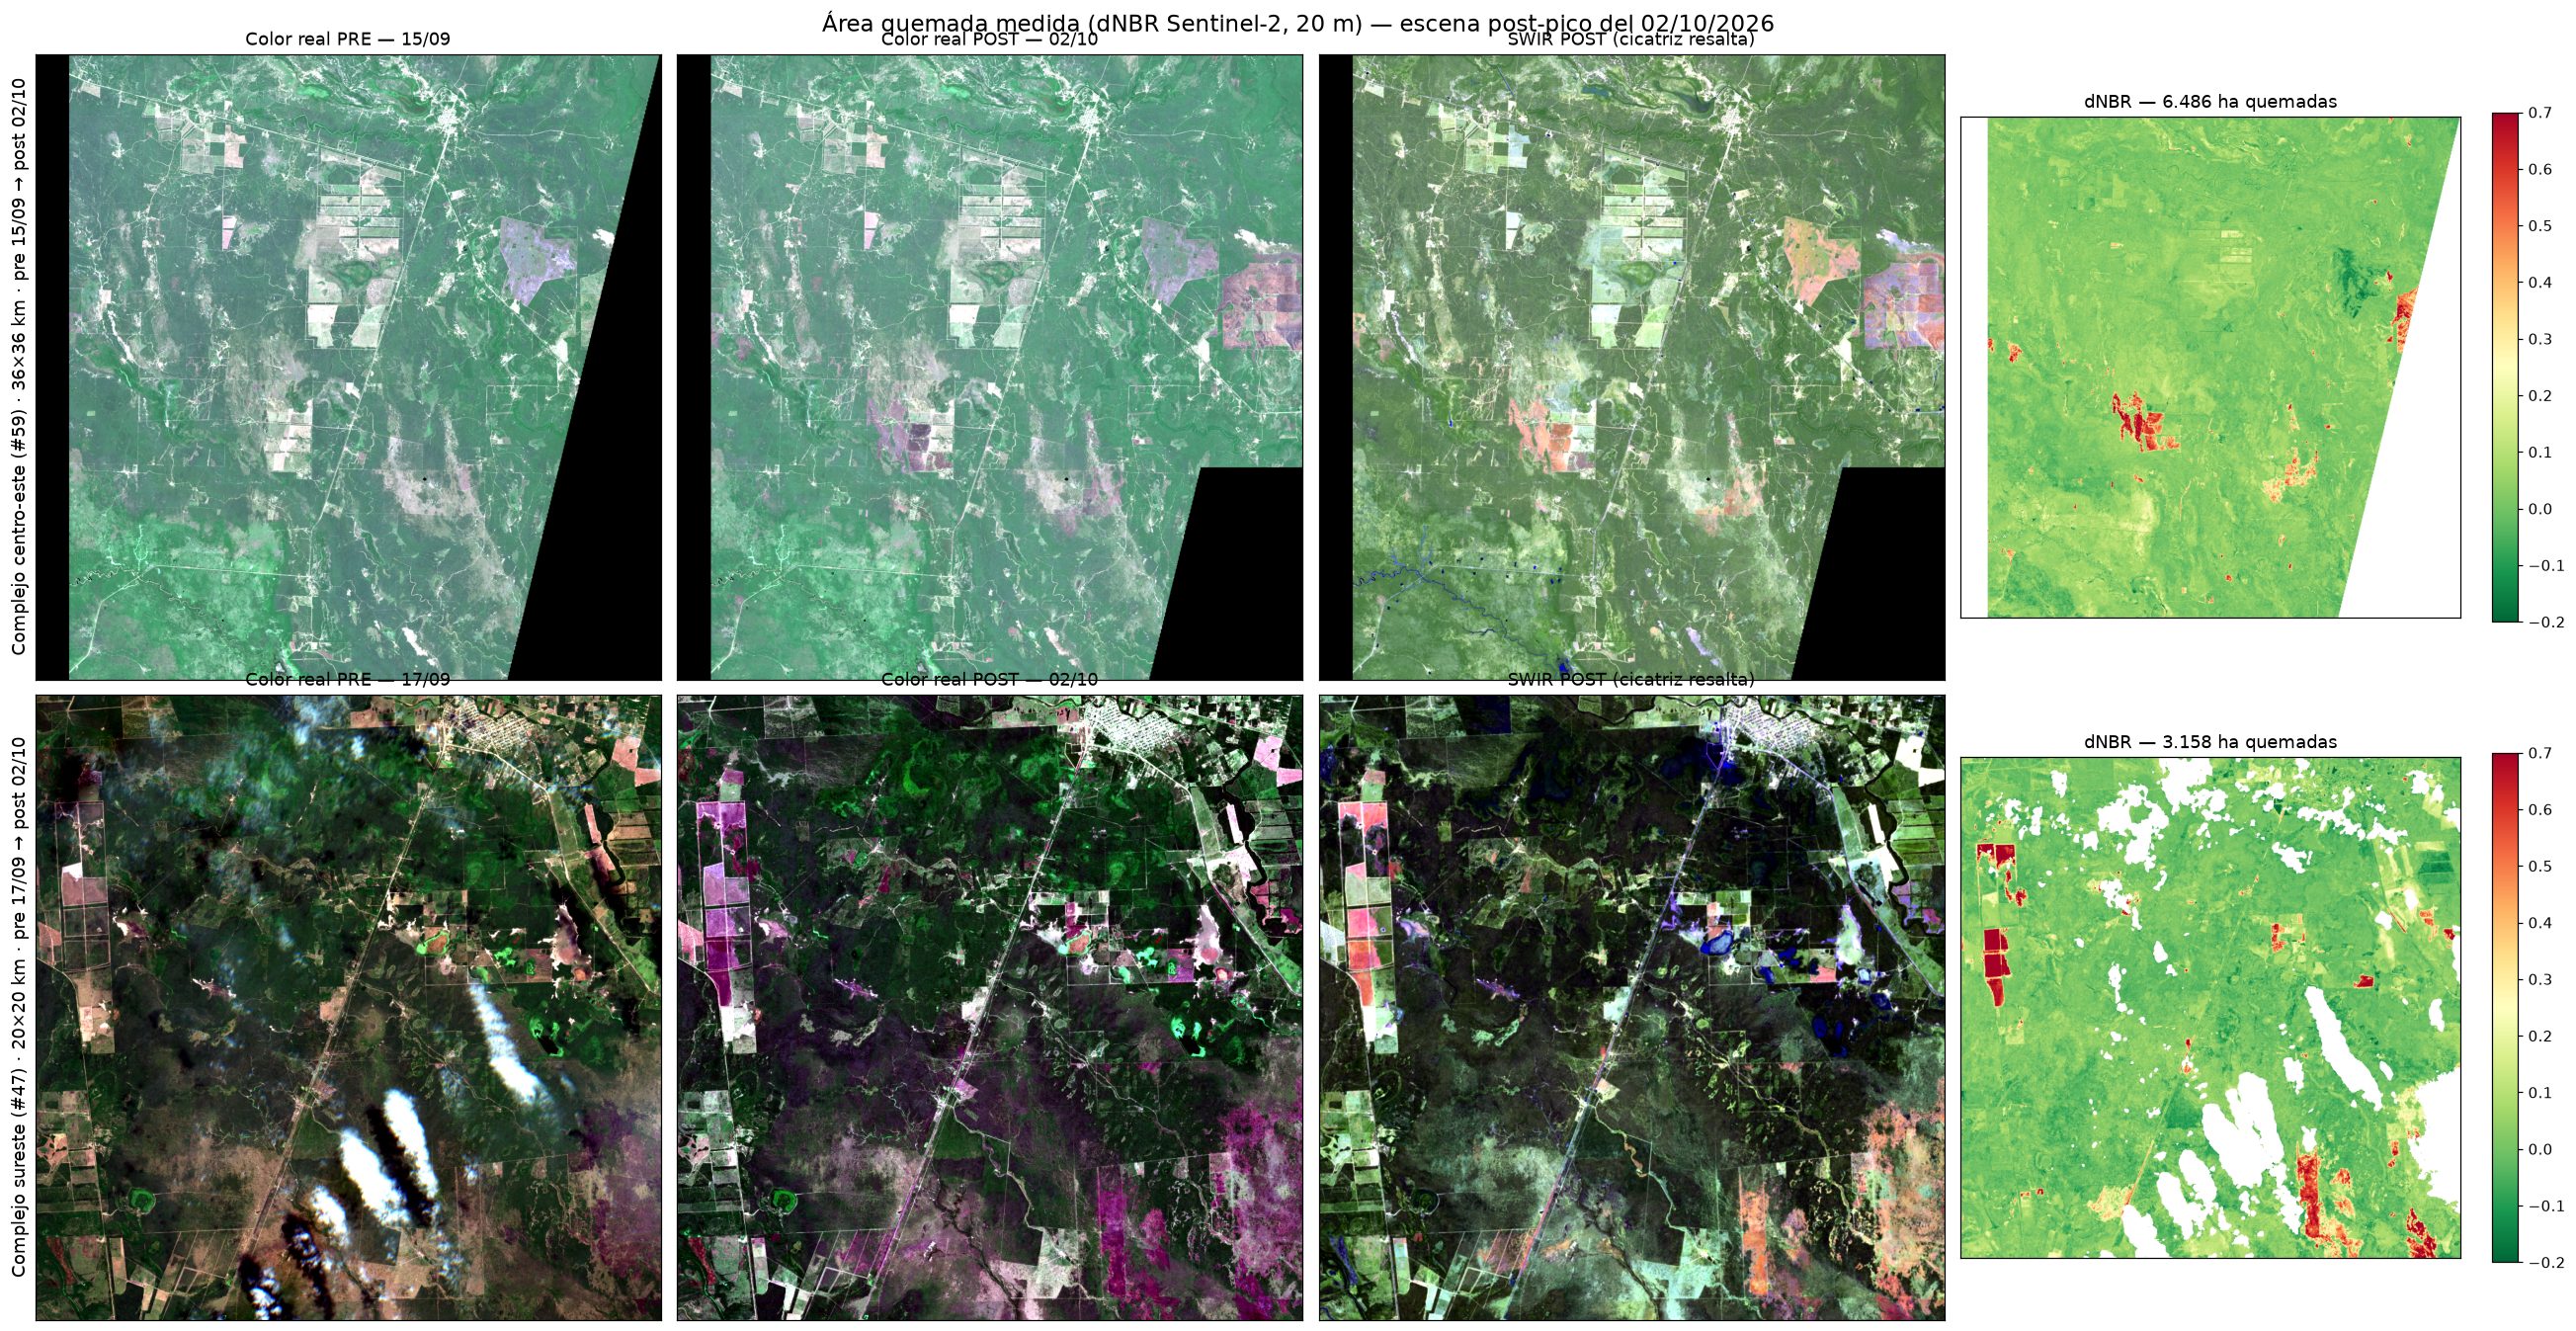
On 02/10 Sentinel-2 published the first clean pass after the peak (0% cloud cover over the central-eastern province). With it we closed the dNBR for the two central-eastern complexes:
| Severity (USGS thresholds) | Central-east | South-east | Total |
|---|---|---|---|
| Low (0.10–0.27) | 4,413 ha | 1,837 ha | 6,250 ha |
| Moderate (0.27–0.44) | 901 ha | 460 ha | 1,361 ha |
| High (0.44–0.66) | 978 ha | 532 ha | 1,511 ha |
| Severe (>0.66) | 193 ha | 329 ha | 522 ha |
| Total burned area | 6,486 ha | 3,158 ha | 9,644 ha |
Crossing the dNBR burn mask (not the VIIRS footprint) with ESA WorldCover: 6,846 of the 9,644 ha burned were native dry forest (monte) (71%), of which 1,391 ha burned at high or severe intensity. The remainder was primarily grassland (~2,600 ha).
5 · The forest before and after, in true colour
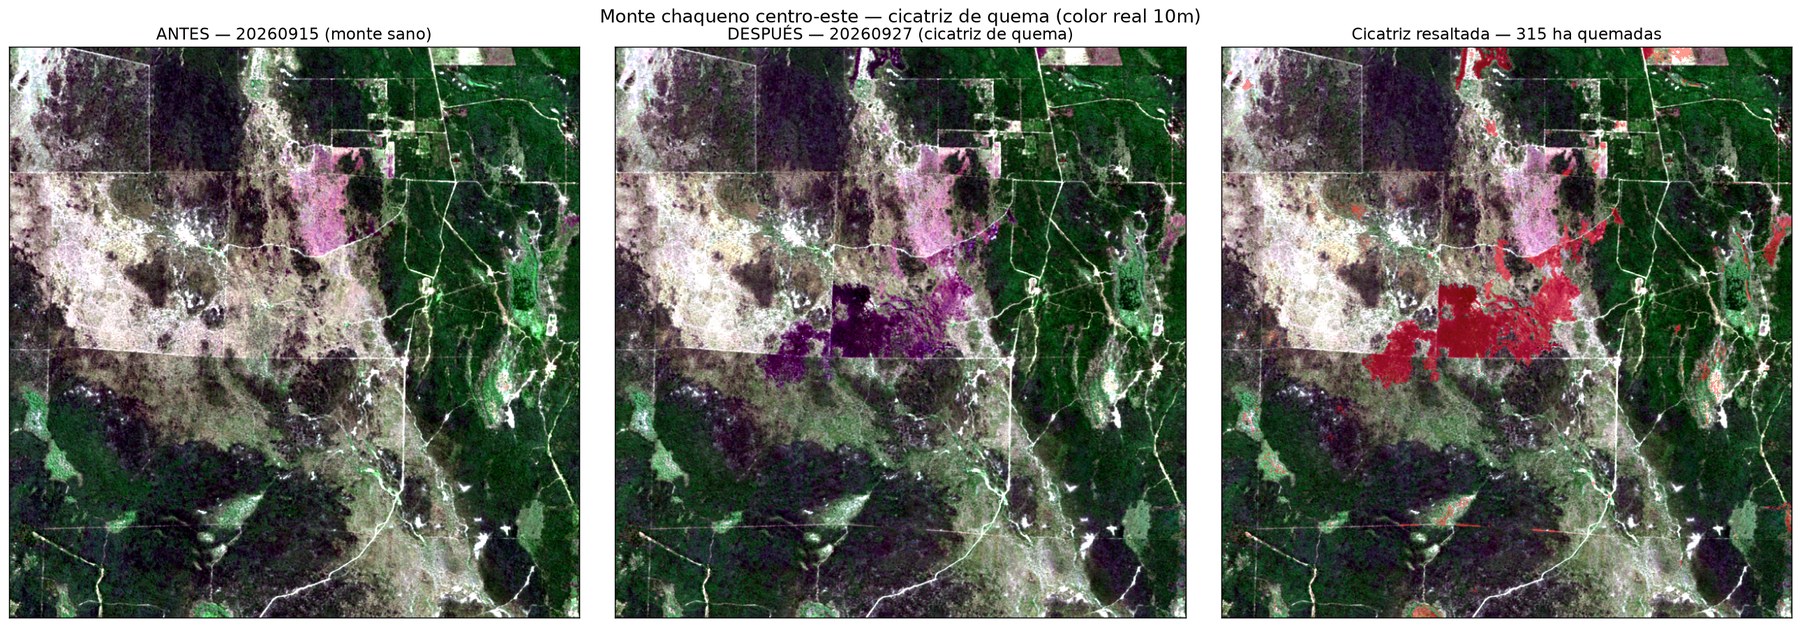
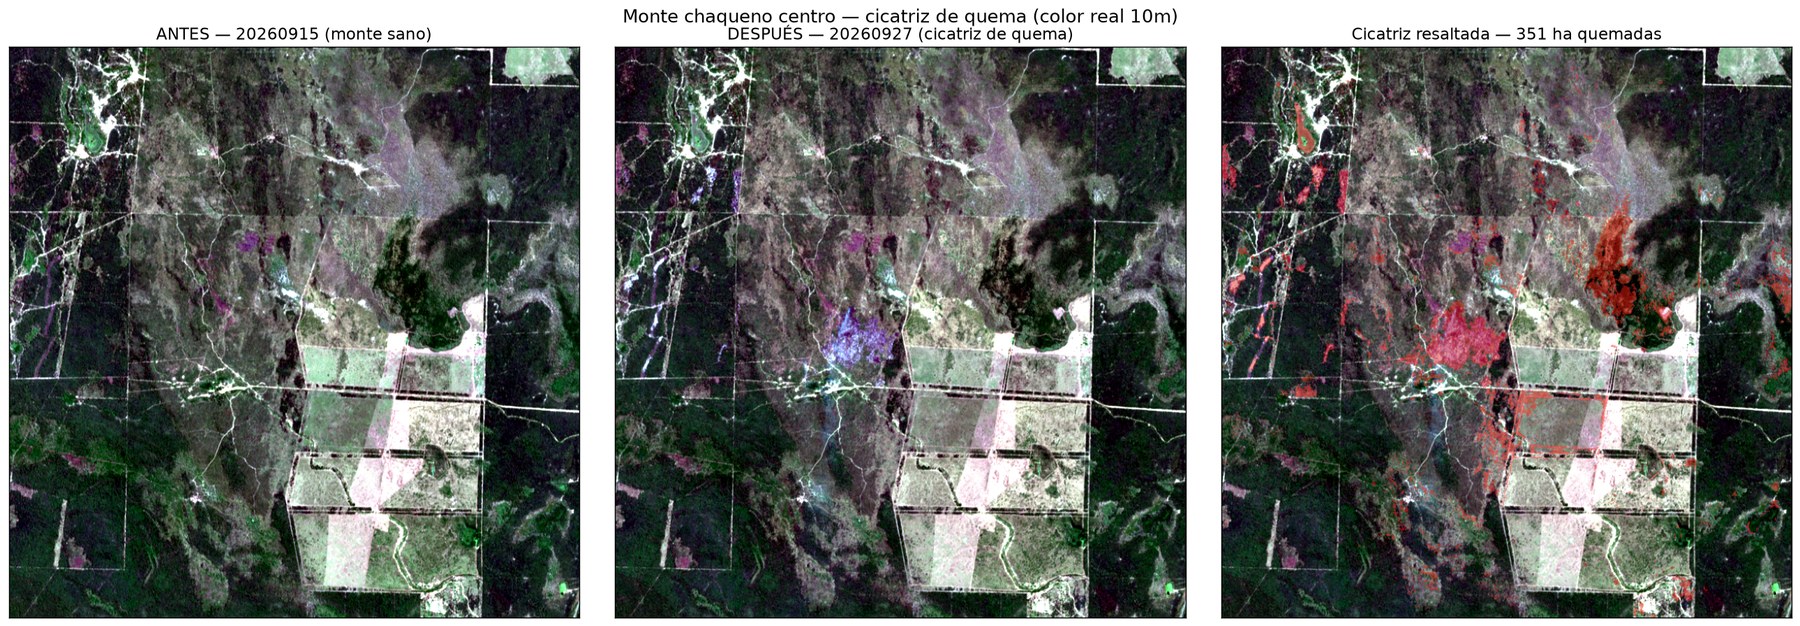
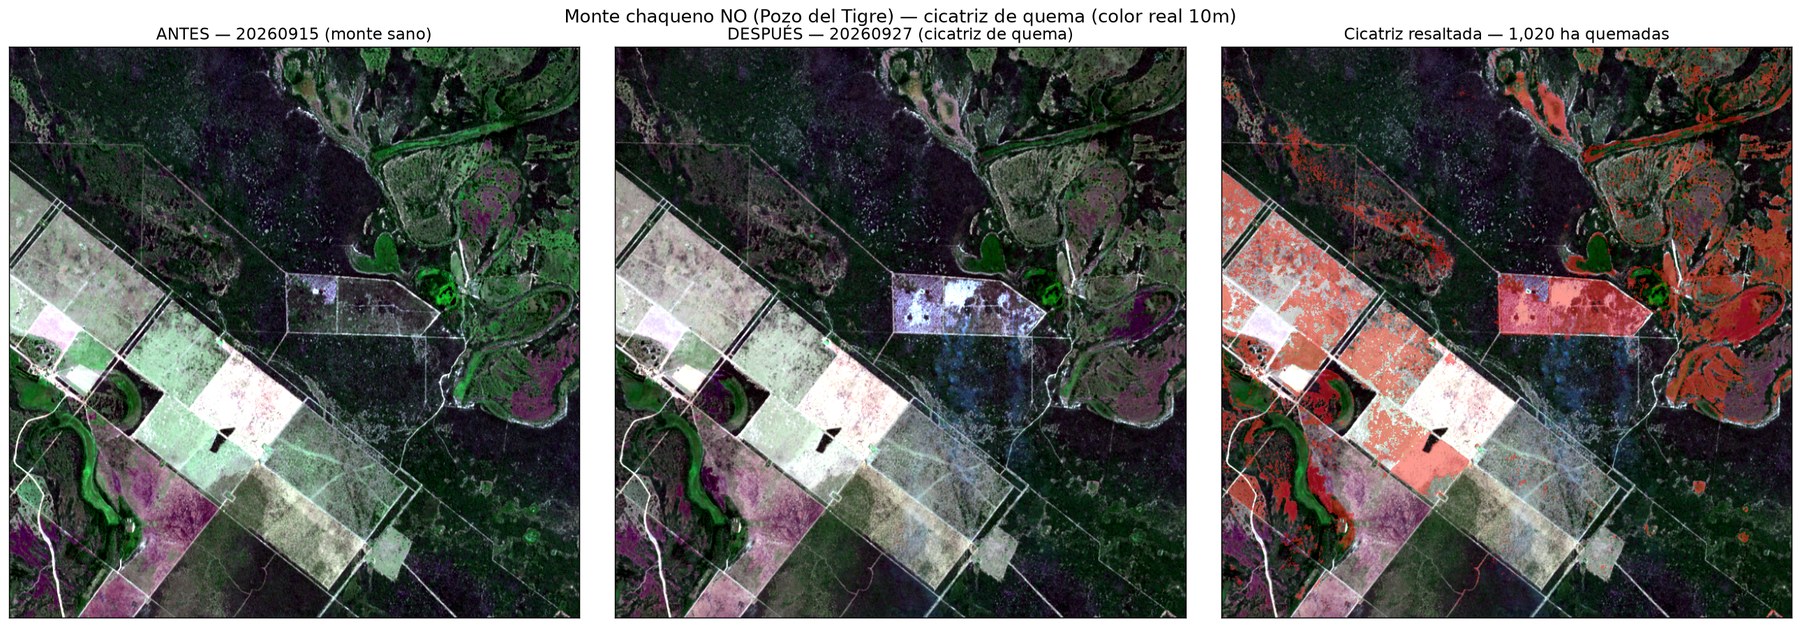
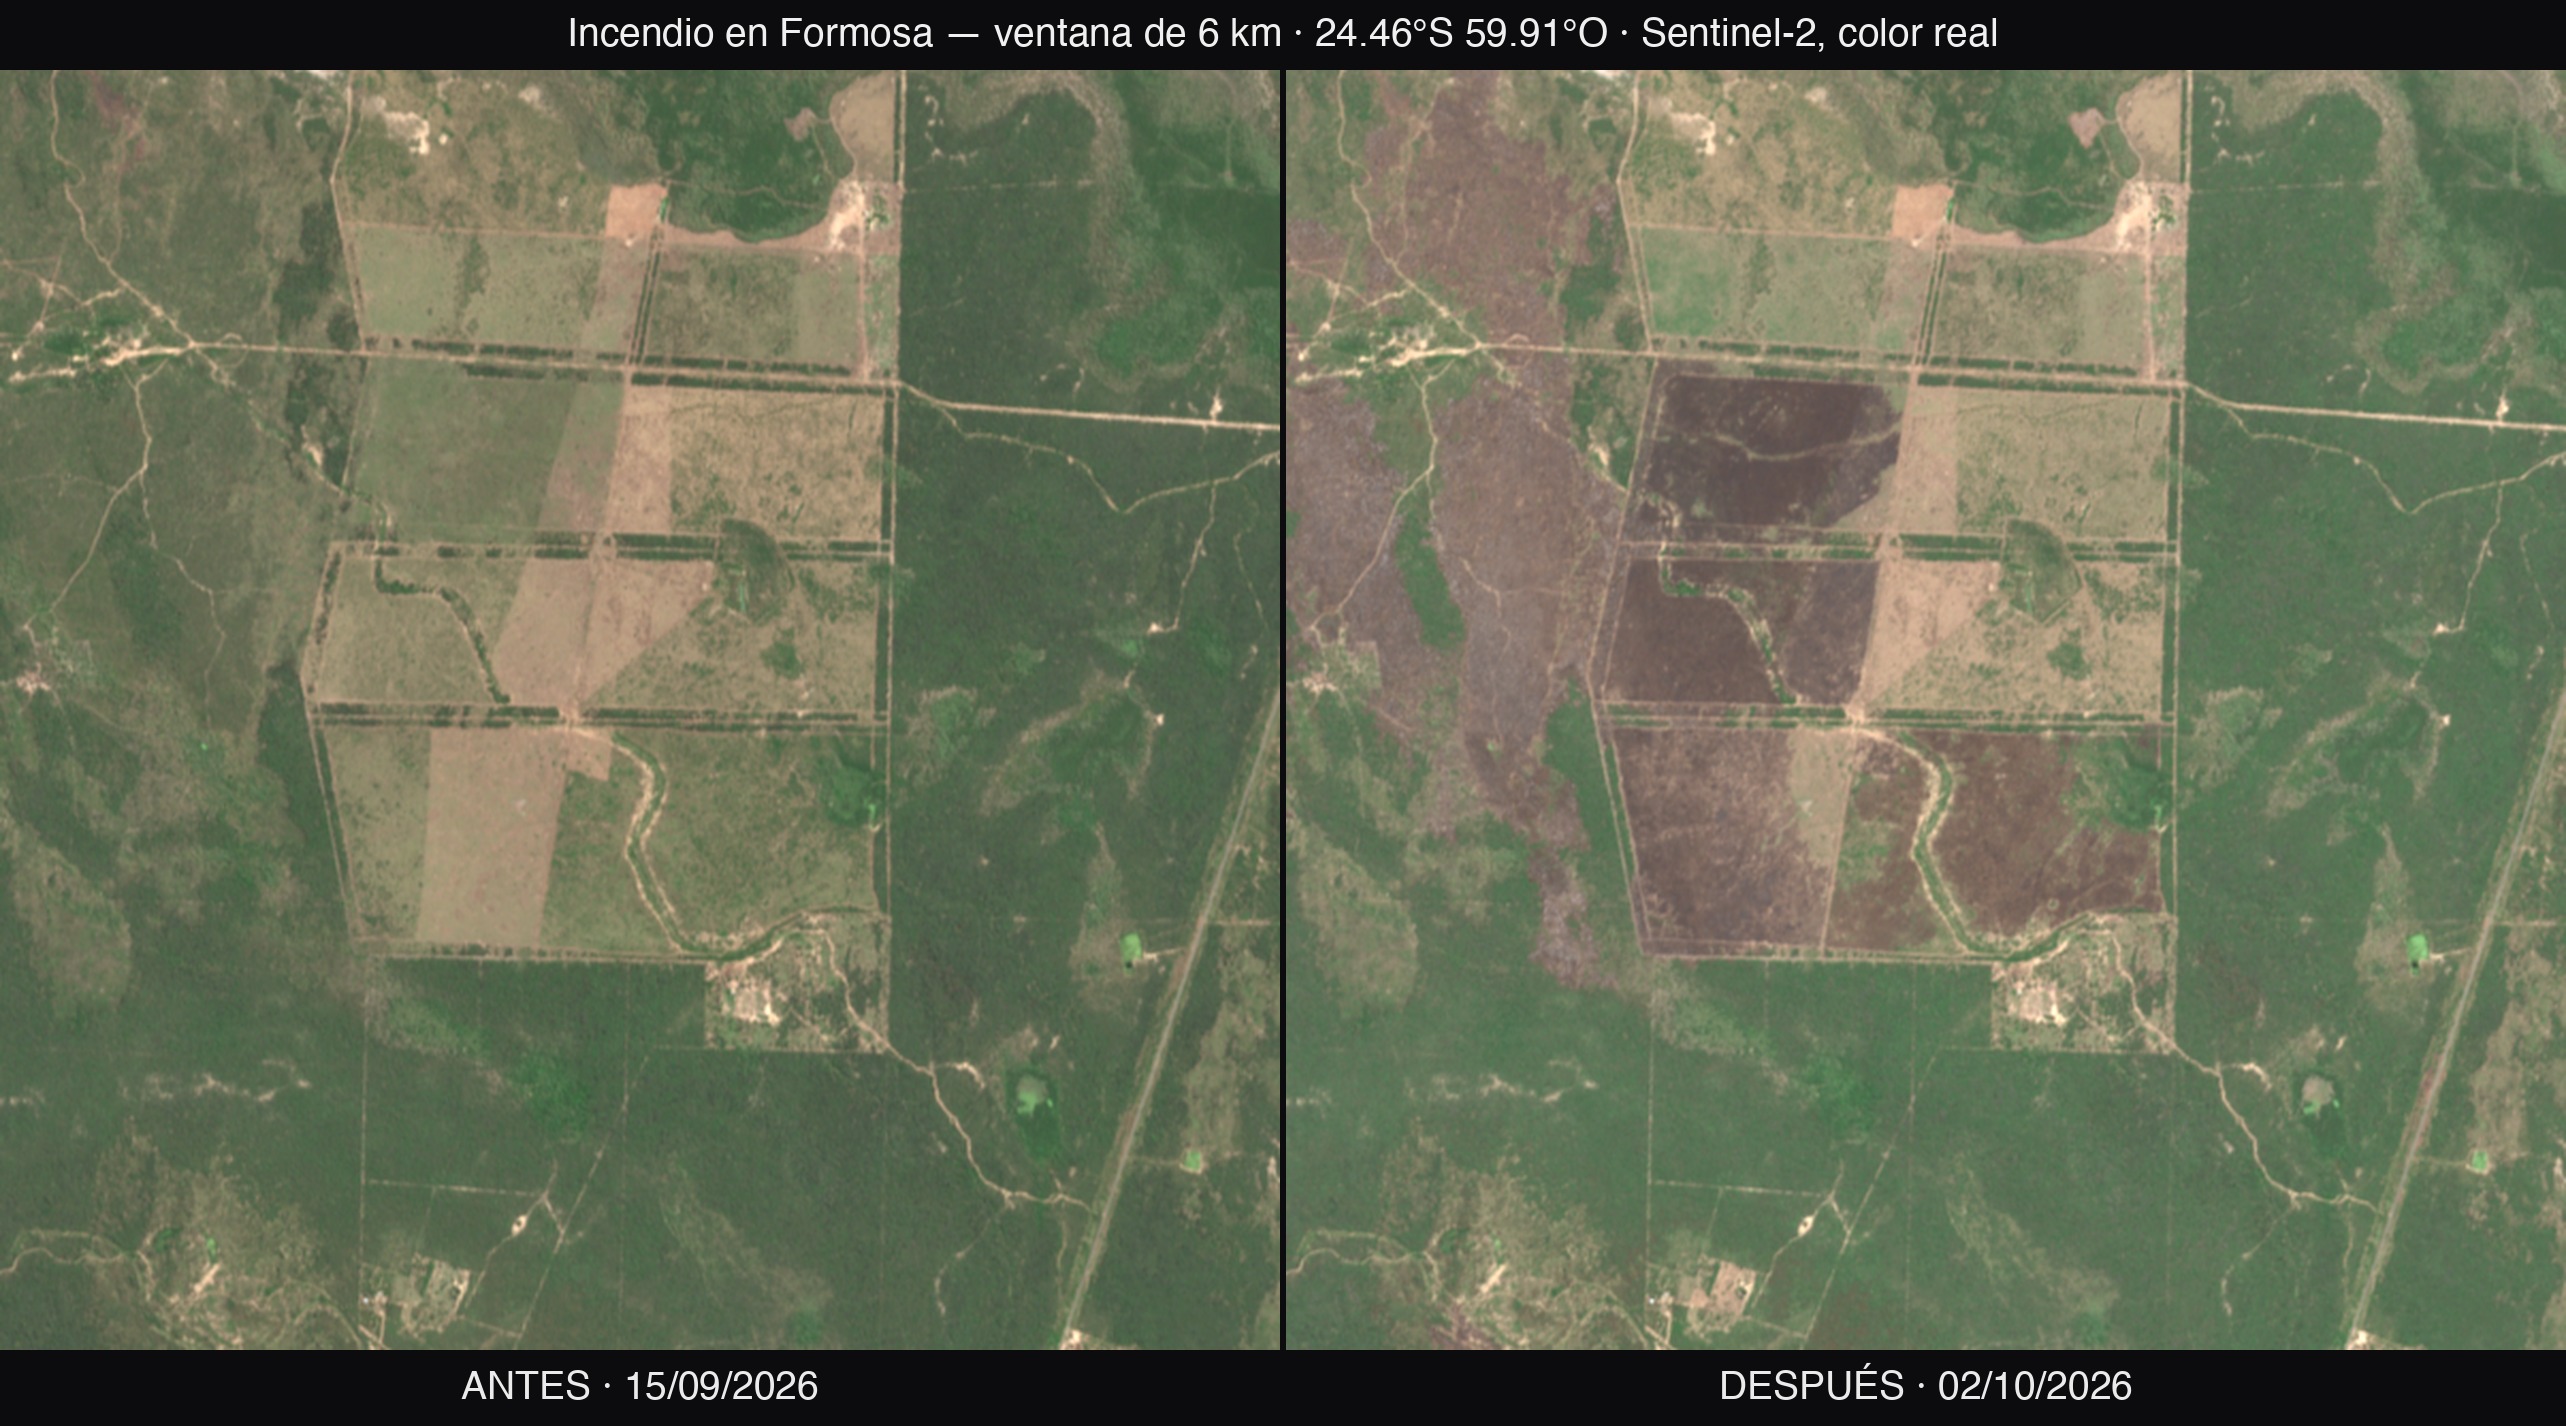
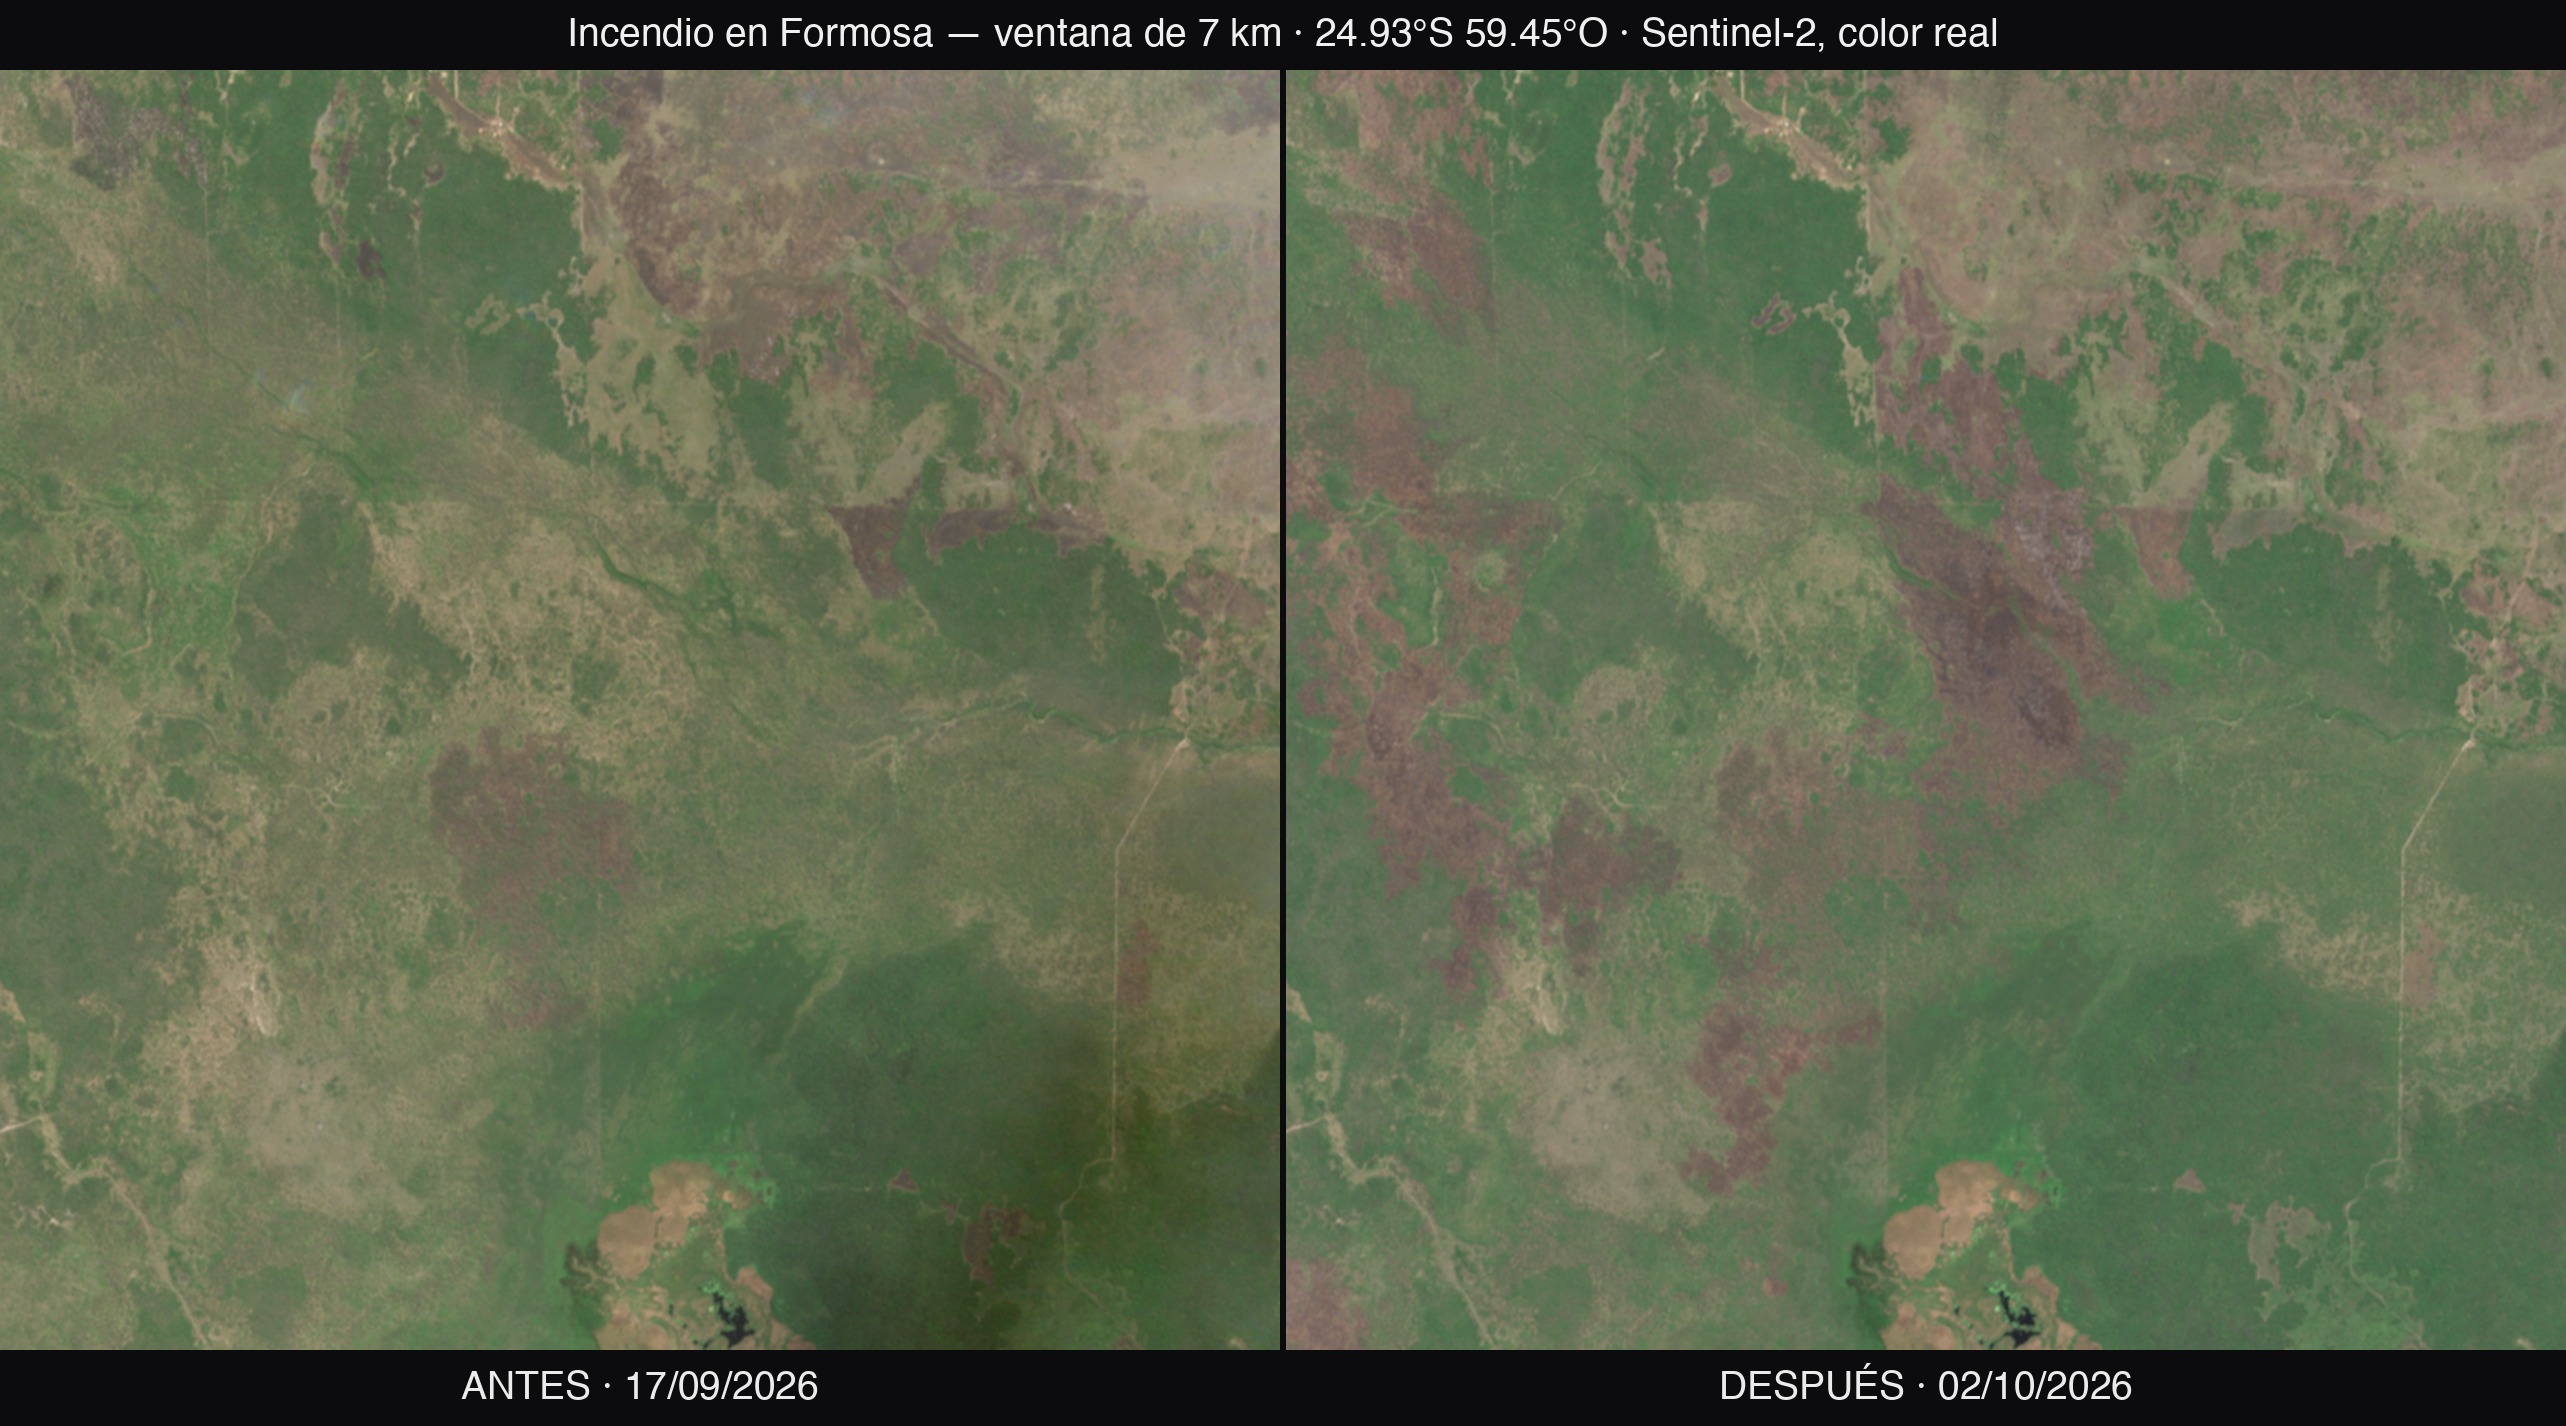
The figures give the scale; the optical images show the change on the ground. These are Sentinel-2 images at 10 metres resolution over three nuclei of native dry forest (monte) (confirmed as forest by WorldCover), comparing cover from 15/09 with that from 27/09.
Update 04/10 — before/after with the post-peak scene
With the clean 02/10 pass, the before/after of the central-eastern complex was completed: the same frame, 17 days apart, with the fire in between.
6 · The territory: land cover and protected areas
Bañado La Estrella — the wetland on the fire's edge
The fire footprint borders the Bañado La Estrella, the second-largest wetland in Argentina (~400,000 ha) and the third in South America. It is a Provincial Nature Reserve (Formosa Law 1471/2005), an Important Bird and Biodiversity Area, and one of the country's 7 Natural Wonders. It harbours more than 300 bird species — nearly half of those recorded in Argentina — along with yacarés, carpinchos, curiyú, aguará guazú, and giant anteater. It is the fishing source for the Wichí, Pilagá, and Qom communities.
Protected areas exposed
The Reserva Natural Formosa (Administración de Parques Nacionales (National Parks Administration), 9,005 ha, Bermejo department) is the most exposed national protected area: at the south-western edge, within range of the event, in the heart of the Dry Chaco. Parque Nacional Río Pilcomayo (RAMSAR site, 51,889 ha) was far away, to the north-east.
The affected ecosystem — Dry Chaco
The dominant cover under the fire footprint is the native forest of the Dry Chaco, one of the most extensive xeric forest masses in South America.
Quebracho coloradoQuebracho blancoPalo santoAlgarroboYaguaretéOso hormigueroTatú carretaPecarí quimilero — species of the Chaco native forest of the area, several declared Natural Monument.
7 · Population of the area
The affected western strip —Patiño, Ramón Lista, Matacos, and Bermejo departments— totals approximately 132,000 inhabitants (2022 Census), mostly dispersed rural population: criollo settlements and indigenous communities.
| Department | County seat | Inhabitants (2022) |
|---|---|---|
| Patiño | Las Lomitas | 81,819 |
| Ramón Lista (epicentre: Pozo de Maza) | Gral. Mosconi | 17,729 |
| Matacos | Ing. Juárez | 17,032 |
| Bermejo | Laguna Yema | 15,644 |
Western Formosa is a heartland of indigenous presence: Wichí (predominant in the burned zone), Pilagá, Nivaclé, and Qom peoples. Their livelihoods are historically tied to the native forest (hunting, gathering, honey, timber, chaguar fibre) and to the wetland (fishing).
8 · Methodology and data integrity
What we measured and how.
- Fire activity: VIIRS detections (S-NPP, NOAA-20/21) from NASA's FIRMS system, ingested and aggregated by province in GeoFuego's own database. FRP = Fire Radiative Power, a proxy for intensity.
- Fire footprint (~53,900 ha): 375 m grid (VIIRS pixel resolution) marked where there were ≥1 detections during the 24–28/09 peak. It is the active-fire footprint, a defensible proxy for the affected area — not identical to the final burned area.
- Land cover: ESA WorldCover 2021 (10 m), resampled by majority class to the fire grid. Its date (2021) means that part of the 'forest' may have changed since then.
- Burn scar (dNBR): Sentinel-2 at 20 m, NBR=(B8A−B12)/(B8A+B12), pre−post difference, USGS severity classes. Post-peak: scene of 02/10 (0% clouds over the central-east). Burned forest = dNBR mask > 0.10 × WorldCover. Accurate but limited to windows with a clear post-fire scene.
What we do NOT claim. The provincial total remains open: the western cores do not yet have a clear post-fire scene, and their hectares are neither estimated nor interpolated — they will be measured with the next clean pass (~05/10). The 9,644 ha measured is a floor, not a total. We always distinguish 'active-fire footprint' (VIIRS) from 'burned area' (dNBR) — they are not the same, and saying otherwise would inflate the figure.
Explore the evidence
A documented case by GeoFuego in collaboration with Copernicus — Territorial Intelligence. Open data, reproducible methodology; each satellite figure is derived from public data (NASA FIRMS, ESA Copernicus Sentinel-2, ESA WorldCover, Open-Meteo). Context: INDEC Censo 2022, Administración de Parques Nacionales (National Parks Administration), Ley 26.331 de Bosques Nativos (Native Forest Law). Licence CC BY-NC 4.0.
This study is a satellite analysis for dissemination and prevention — it is not an official alert and does not replace the Servicio Nacional de Manejo del Fuego (National Fire Management Service) or Defensa Civil (Civil Defence). In the event of an active fire, call 100 (Fire Brigade) or 911.
GEOFUEGO · satellite monitoring — a product of AgentNEO.